Metrics library
- Realized cap: valuing coins at the price they last moved
- Realized price: the average price coins last moved at
- MVRV ratio: market value compared with realized value
- NVT ratio: network value compared with on-chain volume
- NUPL: how much paper profit or loss the network holds
- SOPR: are coins being spent at a profit or a loss?
- Percent supply in profit: how many coins are above water
- HODL waves: reading Bitcoin’s supply by coin age
- Coin Days Destroyed: measuring when old bitcoin starts to move
- Hash rate: how much work is securing Bitcoin
- Active addresses: counting who used the chain — roughly
- Puell Multiple: is miner income high or low compared with the past year?
- Exchange netflow: coins in minus coins out
- Stablecoin supply ratio (SSR): Bitcoin’s size against the stablecoin pile
- Funding rate: the price of staying long or short in perpetual futures
- Open interest: how much leveraged exposure is open right now
Percent supply in profit: how many coins are above water
This metric counts coins, not dollars. It tells you what share of the supply would show a gain if sold at today’s price — and nothing about how big that gain is.

Photo: “Harvested Fields 3” by Gordon M Robertson, CC BY 2.0, via Flickr (edited: cropped and resized).
Percent supply in profit is the share of circulating supply whose current price is higher than the price when those coins last moved on-chain [1]. It is binary per coin: a coin is either in profit or not, whatever the size of the gain [2].
Key points
- 1A coin is “in profit” if today’s price is above the price when it last moved on-chain.
- 2Percent supply in profit = coins in profit ÷ total supply × 100.
- 3It ignores how large each gain is, so it can jump when price crosses a level where many coins last moved.
- 4Glassnode’s guide links readings above 95% to past tops and below 5% to past bottoms — conventions, not rules.
What does percent supply in profit measure?#
Every coin has a price attached to the moment it last moved on-chain. If today’s price is higher, that coin is said to be in profit; if lower, in loss [1]. Supply in profit is simply the number of coins in profit [2]. Percent supply in profit divides that number by the total supply, so the result always sits between 0% and 100% [1].
Glassnode stresses the key difference from unrealized profit, the input behind NUPL: supply in profit does not care how much profit a coin has, only whether it has any [2]. A coin up 0.1% and a coin up 10,000% count the same. That makes it a headcount of coins, where unrealized profit is a sum of dollars [3].
How is it calculated?#
Percent supply in profit = 100 × (coins whose last-move price < today’s price) ÷ total supplyGlassnode adds up every UTXO created at a price below the current price, then divides by total supply and converts to a percentage [2] [1].
| Step | Value |
|---|---|
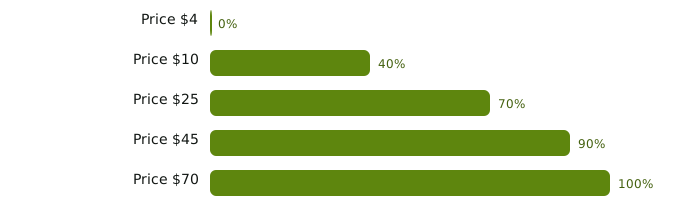
| Price $4: no group is in profit | 0% |
| Price $10: only the $5 group (400 coins) | 40% |
| Price $25: $5 and $20 groups (700 coins) | 70% |
| Price $45: everything except the $60 group (900 coins) | 90% |
| Price $70: all 1,000 coins | 100% |
The percentage moves in steps, not smoothly, because it only changes when the price crosses a level where coins last moved.
Percent supply in profit for the example coin

Why can it jump on a tiny price move?#
Because it is binary. In the example ledger, 300 coins last moved at exactly $20. At a price of $19.99 they count as in loss and the metric reads 40%. At $20.01 — a gain of just 0.05% for those holders — they count as in profit and the metric reads 70%. Thirty percentage points from a two-cent move.
Real markets have the same feature on a bigger scale. Glassnode’s URPD chart shows how many existing bitcoins last moved within each price bucket [4]. Where a large cluster of coins sits, percent supply in profit will move sharply as the price passes through it. Looking at the distribution helps explain sudden swings in the percentage.
How do analysts read percent supply in profit?#
| Reading | What it means | Convention some analysts use |
|---|---|---|
| Above 95% | Almost every coin shows a paper gain | Glassnode: in general suggests market tops |
| Around 50% | Half the coins in profit, half not | No standard interpretation |
| Below 5% | Almost every coin shows a paper loss | Glassnode: in general signals bottoms |
| Sharp jump | Price crossed a cluster of last-move prices | Check a price-distribution chart first |
The 95% and 5% levels come from Glassnode’s metric guide, which calls the metric an oscillator and states those levels in general terms [1]. Glassnode also says the absolute supply in profit can help highlight tops, when many holders may be close to taking profit, and supply in loss can help highlight bottoms [2] [5]. Treat these as one provider’s reading of past cycles.
Where does it mislead?#
- It ignores size. A market where most coins are up 1% and one where most are up 300% can show the same percentage. Pair it with NUPL or the MVRV ratio, which measure size.
- Lost coins prop it up. Coins presumed lost have not moved since around 2010 [7], when bitcoin had not yet reached $1 [8], so they count as in profit at almost any price.
- Moves reset the reference price. A coin moved to the owner’s own new address takes today’s price as its new “cost” — the same weakness as realized price. Most Bitcoin transactions also create change outputs that are re-priced this way [9].
- Coins are not people. One exchange wallet can hold more coins than thousands of individuals. Address-based versions, such as Look Into Bitcoin’s percent addresses in profit chart, count something different again [10].
Percent supply in profit in one box
What mistakes do beginners make here?#
- Reading it as the share of people in profit
It counts coins, weighted equally per coin. A few large holders can dominate the result.
- Treating 95% or 5% as triggers
They are conventions from one provider’s guide. Past cycles did not all behave the same way at those levels.
- Assuming bigger profits when the number rises
The metric is binary. A rise can mean many coins just crossed break-even, not that gains got larger.
- Forgetting about lost coins
Old, presumed-lost coins sit in profit almost permanently and keep the percentage higher than active holders’ reality.
Frequently asked questions#
What is the difference between supply in profit and percent supply in profit?
If 80% of supply is in profit, are 80% of holders in profit?
Not necessarily. The metric counts coins, not owners, and it uses the last on-chain move as each coin’s cost, which may not match what any person paid.
Does it measure how much profit there is?
No. Glassnode notes it ignores the amount of profit and only records whether a coin is in profit [2]. Use unrealized profit metrics for size.
Is there a supply in loss version?
Yes. Supply in loss counts coins whose last-move price is above today’s price [5].
The bottom line#
Percent supply in profit is a simple headcount: how many coins would show a gain if sold today. It is easy to read, but binary, so it can jump when price crosses a crowded cost level and it says nothing about the size of gains.
Use it alongside measures of size such as NUPL and MVRV, and read our guide to realized price and cost basis for the assumptions underneath.
Sources#
Grade A = primary source (regulator, protocol specification, client code, original author). Grade B = expert secondary source used for explanation only.
- BGlassnode Docs. Percent Supply in Profit, 2026.
- BGlassnode Docs. Supply in Profit, 2026.
- BGlassnode Docs. Unrealized Profit, 2026.
- BGlassnode Docs. URPD (UTXO Realized Price Distribution), 2026.
- BGlassnode Docs. Supply in Loss, 2026.
- AEuropean Supervisory Authorities (EBA, ESMA, EIOPA). EU financial regulators warn consumers on the risks of crypto-assets, 2022.
- BCoin Metrics Data Knowledge Base. Market Capitalization (network data definitions), 2026.
- AUnchained (Dhruv Bansal). Bitcoin Data Science (Pt. 1): HODL Waves, 2018.
- ABitcoin Developer Documentation (developer.bitcoin.org). Transactions (developer guide), 2026.
- BLook Into Bitcoin. Net Unrealized Profit/Loss (NUPL), 2026.