Metrics library
- Realized cap: valuing coins at the price they last moved
- Realized price: the average price coins last moved at
- MVRV ratio: market value compared with realized value
- NVT ratio: network value compared with on-chain volume
- NUPL: how much paper profit or loss the network holds
- SOPR: are coins being spent at a profit or a loss?
- Percent supply in profit: how many coins are above water
- HODL waves: reading Bitcoin’s supply by coin age
- Coin Days Destroyed: measuring when old bitcoin starts to move
- Hash rate: how much work is securing Bitcoin
- Active addresses: counting who used the chain — roughly
- Puell Multiple: is miner income high or low compared with the past year?
- Exchange netflow: coins in minus coins out
- Stablecoin supply ratio (SSR): Bitcoin’s size against the stablecoin pile
- Funding rate: the price of staying long or short in perpetual futures
- Open interest: how much leveraged exposure is open right now
Open interest: how much leveraged exposure is open right now
Open interest adds up every futures and perpetual position that has not yet been closed. It shows how big the derivatives market is at a moment in time — not which way it is betting.

Photo: “The other half of the World Record Tug of War rope.” by jdnx, CC BY 2.0, via Flickr (edited: cropped and resized).
Open interest is the total value of derivative positions still open, measured at a point in time [1]. Every long has a matching short, so it shows how much positioning exists, not its direction. The CFTC’s definition counts each contract once [2]; DefiLlama counts both [1].
Key points
- 1Open interest is a snapshot of open positions; volume is a flow of trades over a period.
- 2In dollar terms it moves with price even when no one opens or closes a position.
- 3The CFTC definition counts one side; some providers, such as DefiLlama, count both long and short, doubling the figure. Check the methodology.
- 4Rising open interest in coins means more leveraged positioning, which can unwind quickly through liquidations.
- 5Open interest has no direction by itself and is not a price forecast.
What does open interest measure?#
Open interest (OI) is the total size of futures or perpetual futures positions that are still open. The US Commodity Futures Trading Commission (CFTC) defines it as the total number of futures contracts “long or short” that have been entered into and not yet closed by an offsetting trade or settled by delivery [2]. For crypto perpetuals, DefiLlama measures it in dollars, as the “total notional USD value of outstanding perpetual positions that have not yet been settled or closed, snapshotted at the end of the period” [1]. Notional means the full size of each position, not the smaller amount of margin posted to hold it.
Every derivative position has someone on the other side: funding, for example, is paid by one side of the contract to the other [3]. So the total of all longs equals the total of all shorts. That is why open interest on its own cannot tell you whether traders are mostly bullish or bearish — it only tells you how much is at stake. For how trades add to or subtract from it, see open interest and liquidations.
Is open interest counted in coins or in dollars?#
Charts use both units, and the difference matters. Open interest in coins (or contracts) only changes when positions open or close. Open interest in dollars is that number multiplied by the price, so it also moves whenever the price moves. A second trap is counting convention. The CFTC’s definition counts contracts “long or short” [2]. Every contract has one buyer, the long, and one seller, the short [2], so that is a one-sided count. DefiLlama says it counts “both long and short sides” [1], which doubles the figure compared with the one-sided count.
| Step | Value |
|---|---|
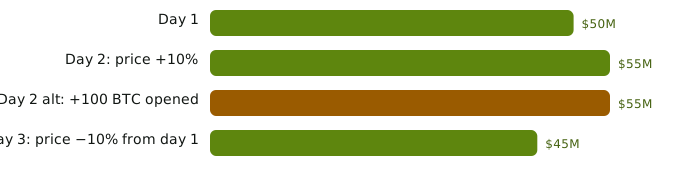
| Day 1: 1,000 BTC × $50,000 | $50 million |
| Day 2: price rises 10% to $55,000, no trades: 1,000 × $55,000 | $55 million |
| Alternative day 2: price flat, 100 BTC of new positions: 1,100 × $50,000 | $55 million |
| Day 3: price falls to $45,000, no trades: 1,000 × $45,000 | $45 million |
| Day 1 counted on both sides | $100 million |
The two versions of day 2 show the same $55 million for completely different reasons. Only open interest in coins separates “price went up” from “new positions opened”.
Dollar open interest in the worked example
How is open interest different from trading volume?#
Volume counts trades during a period; open interest counts positions still open at the end of it. DefiLlama puts it simply: open interest is “a point-in-time measurement, not a flow” [1]. A day of heavy trading in which positions merely change hands can leave open interest unchanged.
The two together can reveal suspicious data. DefiLlama treats “an implausible volume-to-TVL or volume-to-open-interest ratio” as wash trading until explained [1] — huge reported volume against very little open interest suggests trades that do not reflect real positions.
How do data providers build open interest charts?#
Positions live on each venue’s books, so market-wide open interest is an aggregate. Glassnode lists open interest among its futures metrics, updated every 10 minutes with a nightly backfill [4], and publishes a Total Open Interest that sums open interest across baskets of assets [5]. It recommends a log scale for valuation-type series including open interest [5], and warns that a single exchange’s perpetual futures positions can be reported late [6].
How do analysts read open interest?#
| What you see | Possible reading | What it does not tell you |
|---|---|---|
| Open interest in coins rising | New leveraged positions are opening on both sides | Which side will be right |
| Dollar open interest rising, coin open interest flat | Mostly a price effect | That new money entered |
| Sharp fall during a big price move | Positions closed, many possibly through liquidation | That the move is over |
| Open interest high relative to its own history | More leverage in the system to unwind | When an unwind will happen |
Pair open interest with the funding rate: funding shows which side is paying to stay in, open interest shows how large the positioning is. Neither one predicts price.
Open interest in one box
- Measures
- Size of derivative positions still open
- Type of measure
- Point-in-time snapshot, not a flow [1]
- Counting convention (CFTC)
- One side: contracts long or short [2]
- Counting convention (DefiLlama)
- Both long and short sides counted [1]
- Aggregated chart update cadence (Glassnode)
- Every 10 minutes [4]
- Suggested chart scale (Glassnode)
- Logarithmic [5]
What mistakes do beginners make here?#
- Reading open interest as bullish or bearish
Every long has a short. Open interest measures size, not direction.
- Ignoring the price effect
Dollar open interest rises with price. Check the figure in coins before concluding that new positions opened.
- Mixing one-sided and two-sided figures
A both-sides count is twice a one-sided count for the same market.
- Comparing providers with different venue coverage
Aggregates include different exchanges and may revise late data, so totals rarely match exactly.
Frequently asked questions#
What is a “high” open interest?
There is no fixed threshold. Compare open interest with its own history and with the size of the spot market, using the same provider and the same counting convention.
Does open interest include options?
It depends on the provider. DefiLlama, for example, does not track options open interest because it says that figure is trivially inflatable [1].
Why did open interest drop while price barely moved?
Traders closed positions on both sides, voluntarily or through liquidations elsewhere. Open interest only falls when positions close.
Is open interest the same as money invested?
No. It counts the notional size of positions, which with leverage is many times the margin actually posted.
The bottom line#
Open interest is a snapshot of how much leveraged exposure is open. It is most useful in coins rather than dollars, compared with its own history, and read alongside funding and liquidation data.
For the mechanics behind it, read open interest and liquidations and spot vs derivatives.
Sources#
Grade A = primary source (regulator, protocol specification, client code, original author). Grade B = expert secondary source used for explanation only.
- BDefiLlama. Data Definitions (Open Interest), 2026.
- AU.S. Commodity Futures Trading Commission. Futures Glossary: A Guide to the Language of the Futures Industry, 2026.
- AHyperliquid Docs. Funding, 2026.
- BGlassnode Docs. Datapoint Finalization, 2026.
- BGlassnode Docs. Global Metrics Methodology, 2026.
- BGlassnode Docs. Point-in-Time Metrics, 2026.
- AHyperliquid Docs. Liquidations, 2026. Used as one example of how a venue documents liquidations; other venues differ.
- AU.S. Commodity Futures Trading Commission. Customer Advisory: Understand the Risks of Virtual Currency Trading, 2026.