Metrics library
- Realized cap: valuing coins at the price they last moved
- Realized price: the average price coins last moved at
- MVRV ratio: market value compared with realized value
- NVT ratio: network value compared with on-chain volume
- NUPL: how much paper profit or loss the network holds
- SOPR: are coins being spent at a profit or a loss?
- Percent supply in profit: how many coins are above water
- HODL waves: reading Bitcoin’s supply by coin age
- Coin Days Destroyed: measuring when old bitcoin starts to move
- Hash rate: how much work is securing Bitcoin
- Active addresses: counting who used the chain — roughly
- Puell Multiple: is miner income high or low compared with the past year?
- Exchange netflow: coins in minus coins out
- Stablecoin supply ratio (SSR): Bitcoin’s size against the stablecoin pile
- Funding rate: the price of staying long or short in perpetual futures
- Open interest: how much leveraged exposure is open right now
Coin Days Destroyed: measuring when old bitcoin starts to move
Coin Days Destroyed multiplies each spent coin by how long it had been sitting still. A small transfer of very old coins can outweigh a flood of fresh ones — which is exactly the point.
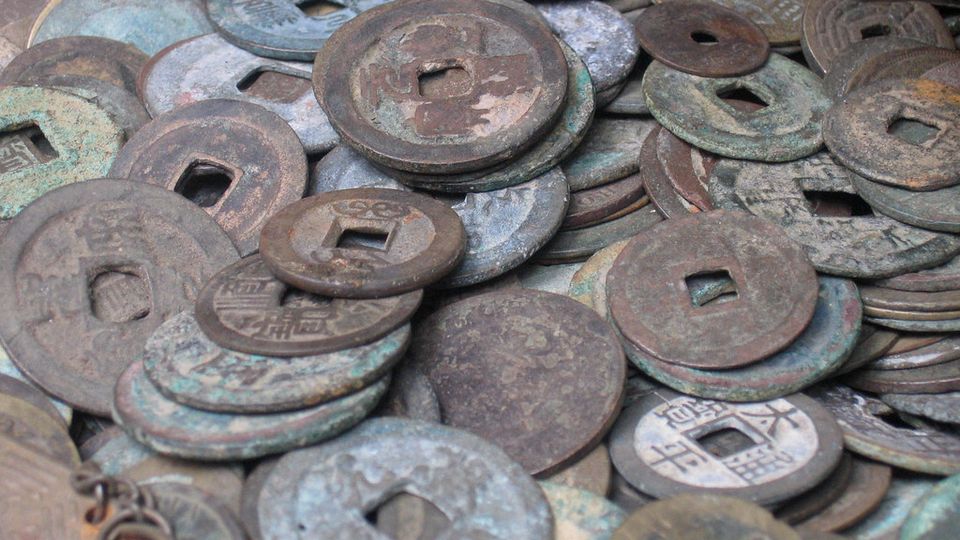
Photo: “old coins” by mc559, CC BY-SA 2.0, via Flickr (edited: cropped and resized).
Coin Days Destroyed (CDD) multiplies the number of coins spent by the number of days since those coins last moved [1]. Every unspent coin earns one coin day per day; spending it resets the count to zero. CDD sums the days destroyed by all coins spent in a period [2].
Key points
- 1CDD weights on-chain spending by coin age, so old coins moving count far more than young coins moving.
- 2It dates from a 2011 Bitcoin Forum proposal and is used as an alternative to raw transaction volume, which is easy to inflate by shuffling coins.
- 3Spikes often draw attention as possible long-term-holder selling, but a spike only proves old coins moved, not that they were sold.
- 4Raw CDD drifts upward over time; supply-adjusted versions make different years easier to compare.
What does Coin Days Destroyed measure?#
Bitcoin does not track balances like a bank account. It tracks individual pieces of bitcoin called UTXOs — unspent transaction outputs that can be spent as inputs in a new transaction [3]. Each one has a creation date on the blockchain, so anyone can see how long it has been sitting unmoved. (See what a UTXO is.)
Coin Days Destroyed uses that age. Glassnode describes it as a measure of economic activity that gives more weight to coins that have not been spent for a long time. Every day a coin stays unspent it accumulates one “coin day”; when it is spent, those accumulated days are reset to zero — “destroyed” — and recorded by the metric [2]. The idea was first proposed on the Bitcoin Forum by a user called ByteCoin in 2011 [2].
How coin days build up and get destroyed


How is Coin Days Destroyed calculated?#
CDD (period) = Σ over every spent output of (BTC amount × days since it was created)For each output spent during the period, multiply its value by its lifespan in days, then add them all up [2]. Look Into Bitcoin states the same rule as number of coins × days since the coins last moved [4].
The Bitcoin Wiki gives the classic example: if someone received 100 BTC a week ago and spends it, 700 bitcoin days are destroyed. If they first send those coins through several addresses and then spend them, total transaction volume can be made arbitrarily large, but the coin days destroyed are still 700 [1]. That resistance to shuffling is why CDD was proposed as a measure of transaction volume in the first place.
| Step | Value |
|---|---|
| Shopper spends 0.5 BTC held 30 days = 0.5 × 30 | 15 coin days |
| Trader moves 10 BTC held 6 hours = 10 × 0.25 | 2.5 coin days |
| Long-term holder moves 50 BTC held 1,500 days = 50 × 1,500 | 75,000 coin days |
| Total CDD for the day | 75,017.5 coin days |
| Long-term holder’s share of BTC moved (50 ÷ 60.5) | ≈ 82.6% |
| Long-term holder’s share of CDD (75,000 ÷ 75,017.5) | ≈ 99.98% |
The trader moved twenty times more bitcoin than the shopper but destroyed far fewer coin days. Glassnode uses the same kind of illustration: 10 BTC dormant for 6 hours accumulates only 2.5 coin days [2].
Share of the day’s CDD in the example


How do analysts read CDD?#
The usual reasoning is about who is moving coins. Holders who have kept coins for a long time are assumed to understand Bitcoin’s cycles better than newcomers, so large movements of old coins are worth watching [4]. Glassnode frames high readings as possibly showing long-term investors spending coins to take profits or losing conviction, and low readings as periods when older coins stay dormant [2]. Those are interpretations built on an assumption about behaviour, not facts the blockchain records.
| What you see | Common interpretation | What it does not prove |
|---|---|---|
| Single large spike | A large batch of old coins moved that day | That they were sold, or who moved them |
| Sustained high or rising CDD | Long-term holders may be spending into strength | That a price top is near |
| Low or falling CDD | Older coins are staying dormant | That holders are buying |
| Values above 20 million coin days | Glassnode: historically uncommon, mostly in volatile periods | A fixed threshold; raw CDD rises over time |
Level from Glassnode’s CDD guide, which also stresses that absolute values must be read in the context of the network’s age [2].
Why does raw CDD rise over time, and how is that fixed?#
The older the network, the more coin days exist to be destroyed. Glassnode notes that the lower bound of CDD increases gradually over time as the whole UTXO set accumulates lifespan, so a reading from today and one from years ago are not directly comparable [2]. Several variations address this.
| Metric | How it is built | Why use it |
|---|---|---|
| CDD | Sum of value × days held for all spent outputs | Raw view of old-coin spending |
| Supply-Adjusted CDD | CDD ÷ circulating supply | Fairer comparison across years [6] |
| Binary CDD | 1 if Supply-Adjusted CDD is above its long-term average, else 0 | Shows streaks of above- or below-average spending [7] |
| Coin Years Destroyed (CYD) | Rolling 365-day sum of CDD | Smooths into an annual view [8] |
| Step | Value |
|---|---|
| CDD for the day | 10,000,000 coin days |
| Circulating supply | 20,000,000 BTC |
| Supply-Adjusted CDD = 10,000,000 ÷ 20,000,000 | 0.5 |
The same raw CDD in an earlier year, when supply was smaller, would produce a larger adjusted value — that is the correction the variation is designed to make.
What are the limits of Coin Days Destroyed?#
- It cannot see intent. On-chain data shows that coins moved, not whether they were sold, lent, or just moved to new storage.
- Large custodians distort it. Exchange wallet consolidations can produce spikes unrelated to investor decisions [5].
- It is noisy day to day. Look Into Bitcoin notes the raw data can be erratic and is usually smoothed with moving averages [4]; Glassnode suggests 7-day or 30-day averages [2].
- It suits UTXO chains. The metric relies on knowing when each coin last moved, which is natural on Bitcoin’s UTXO model; see UTXO vs account model.
- Lost coins never count. Coins whose keys are lost keep accumulating coin days that will never be destroyed.
CDD works best alongside measures that show the age structure of the whole supply, such as HODL waves, and alongside the distinction between long-term and short-term holders.
CDD in one box
What mistakes do beginners make here?#
- Reading every spike as whales selling
A spike only proves old coins moved. Exchange reorganisations and wallet migrations can look identical on-chain.
- Comparing raw CDD across many years
The baseline rises as the network ages. Use a supply-adjusted version for long comparisons.
- Confusing CDD with transaction volume
Volume counts coins moved; CDD counts coins moved times their age. A small amount of very old bitcoin can outweigh a large amount of new bitcoin.
- Acting on a single day
Raw CDD is erratic. Smooth it and look for sustained changes before drawing any conclusion.
Frequently asked questions#
Is Coin Days Destroyed the same as Bitcoin Days Destroyed?
Can someone inflate CDD by sending coins back and forth?
Not much. Freshly moved coins have almost no age, so moving them again destroys few coin days. Glassnode notes that coins sent back and forth can destroy at most one coin day per coin per day [2].
Does a CDD spike mean the price will fall?
No metric can tell you that. A spike says old coins moved; what happens to the price depends on far more than one on-chain measure.
The bottom line#
Coin Days Destroyed is a simple idea with a useful twist: by weighting each spent coin by how long it sat still, it highlights the moments when long-dormant bitcoin wakes up. That makes it a good alert for unusual holder activity, as long as you remember that the blockchain records movement, not motive.
For the bigger picture of how old the supply is, continue with HODL waves and the guide to long-term vs short-term holders.
Sources#
Grade A = primary source (regulator, protocol specification, client code, original author). Grade B = expert secondary source used for explanation only.
- BBitcoin Wiki. Bitcoin Days Destroyed, 2026.
- BGlassnode Docs. CDD (Coin Days Destroyed) — metric guide, 2026.
- Abitcoin.org developer documentation. Bitcoin Developer Glossary: UTXO, 2026.
- BLook Into Bitcoin (formerly Bitcoin Magazine Pro). Coin Days Destroyed, 2026.
- BGlassnode Docs. Reserve Risk — metric guide, 2026.
- BGlassnode Docs. Supply-Adjusted CDD — metric guide, 2026.
- BGlassnode Docs. Binary CDD — metric guide, 2026.
- BGlassnode Docs. CYD (Coin Years Destroyed) — metric guide, 2026.