Metrics library
- Realized cap: valuing coins at the price they last moved
- Realized price: the average price coins last moved at
- MVRV ratio: market value compared with realized value
- NVT ratio: network value compared with on-chain volume
- NUPL: how much paper profit or loss the network holds
- SOPR: are coins being spent at a profit or a loss?
- Percent supply in profit: how many coins are above water
- HODL waves: reading Bitcoin’s supply by coin age
- Coin Days Destroyed: measuring when old bitcoin starts to move
- Hash rate: how much work is securing Bitcoin
- Active addresses: counting who used the chain — roughly
- Puell Multiple: is miner income high or low compared with the past year?
- Exchange netflow: coins in minus coins out
- Stablecoin supply ratio (SSR): Bitcoin’s size against the stablecoin pile
- Funding rate: the price of staying long or short in perpetual futures
- Open interest: how much leveraged exposure is open right now
Stablecoin supply ratio (SSR): Bitcoin’s size against the stablecoin pile
SSR divides Bitcoin’s market value by the market value of all tracked stablecoins. A low number means stablecoins are large relative to Bitcoin — which Glassnode reads as more stablecoin “buying power” to purchase BTC.

Photo: “20110826-FS-LSC-0063” by USDAgov, CC BY 2.0, via Flickr (edited: cropped and resized).
The stablecoin supply ratio (SSR) is Bitcoin’s market capitalization divided by the total market capitalization of all known and tracked stablecoins [1]. When SSR is low, stablecoins are large compared with Bitcoin; Glassnode reads that as more stablecoin “buying power”. It describes potential, not what anyone will actually buy.
Key points
- 1SSR = Bitcoin market cap ÷ total market cap of tracked stablecoins.
- 2SSR falls when stablecoin supply grows or when Bitcoin’s price falls, and rises in the opposite cases.
- 3Glassnode, which documents the metric (created in November 2019 by Renato Shirakashi), reads a low SSR as the stablecoin supply having more “buying power” to purchase BTC.
- 4That reading describes potential buying power, not a measured flow: stablecoins are used for much more than buying bitcoin, and SSR is not a trading signal.
- 5Issuer events, coverage choices and multi-chain counting can move SSR without any change in demand for bitcoin.
What does the stablecoin supply ratio measure?#
Glassnode defines the Stablecoin Supply Ratio (SSR) as the ratio between Bitcoin supply and the supply of stablecoins [1]. It is calculated by dividing the total market capitalization of BTC by the total market cap of all known and tracked stablecoins in circulation [1]. Market capitalization is the number of tokens that exist multiplied by the value per token [2]. For a dollar stablecoin trading near $1, market cap is roughly the number of coins outstanding.
Why compare the two? Stablecoins are the dollars of the crypto world: a Federal Reserve note found that over 80% of trade volume on major centralized exchanges involved a stablecoin as one side of the pair [3]. Glassnode’s reading follows from that: when SSR is low, the current stablecoin supply has more “buying power” to purchase BTC [1]. Glassnode describes SSR as “a proxy for the supply/demand mechanics between BTC and USD” [1]. “Buying power” here means what the stablecoin pile could buy, not what anyone will buy.
SSR = Market cap of Bitcoin ÷ Market cap of all (known and tracked) stablecoinsAs documented by Glassnode, which credits the metric to Renato Shirakashi, created in November 2019 [1]. DefiLlama defines a stablecoin’s market cap as its circulating supply, excluding burned and non-issued tokens, multiplied by its price [4].
How do you calculate SSR?#
| Step | Value |
|---|---|
| Bitcoin market cap (hypothetical) | $1,200 billion |
| Total stablecoin market cap (hypothetical) | $200 billion |
| SSR = 1,200 ÷ 200 | 6.0 |
| Same thing read the other way: stablecoins as a share of BTC = 200 ÷ 1,200 | ≈ 16.7% |
An SSR of 6 means Bitcoin is worth six times the tracked stablecoin supply. Put differently, stablecoins could in theory buy about one-sixth of Bitcoin’s market value — ignoring that prices would move long before that.
| Scenario | BTC market cap | Stablecoin market cap | SSR |
|---|---|---|---|
| Starting point | $1,200B | $200B | 6.0 |
| Stablecoin supply grows 25% | $1,200B | $250B | 4.8 |
| BTC price rises 25% | $1,500B | $200B | 7.5 |
| Both grow 25% | $1,500B | $250B | 6.0 |
| BTC price falls 30% | $840B | $200B | 4.2 |
All inputs hypothetical; SSR computed as BTC market cap ÷ stablecoin market cap.
The same SSR movement can have different causes
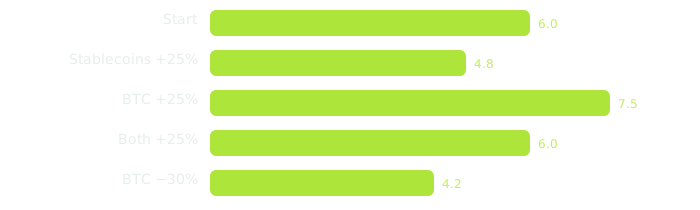
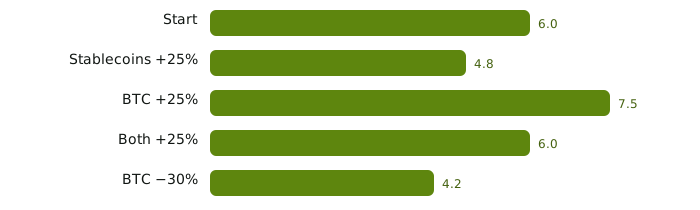
Notice the last row. SSR falls when Bitcoin’s price drops even if not a single new stablecoin is created. A falling SSR therefore does not necessarily mean that new dollars are arriving — it may only mean bitcoin got cheaper. Always check which side of the ratio moved.
How does Glassnode read high and low SSR?#
Glassnode’s guide gives one interpretation: a low SSR means the current stablecoin supply has more buying power to purchase BTC [1]. That is Glassnode’s reading of the ratio, not a measured flow. The guide does not say that a low SSR predicts a price rise, and it gives no threshold for what counts as “low” or “high”.
| What you see | Reading | What it does not tell you |
|---|---|---|
| Low SSR | Glassnode: the stablecoin supply has more “buying power” to purchase BTC [1] | That holders intend to buy bitcoin, or when |
| High SSR | The mirror image of Glassnode’s reading (our inference): less stablecoin buying power relative to BTC | That the price must fall |
| SSR falling with rising stablecoin supply | More stablecoins are in circulation relative to Bitcoin’s market cap | Where those dollars will go: DeFi, payments, trading other coins |
| SSR falling with falling BTC price | Bitcoin got cheaper relative to the stablecoin pile | Anything about new demand |
Is there evidence that stablecoin supply affects crypto prices? Fed researchers summarise studies that find an association: one paper linked on-chain issuance of new stablecoins with abnormal returns on other crypto-assets, while another attributed Bitcoin’s reaction to investor sentiment around announcements of new Tether minting [5]. An association is not proof that stablecoins drive prices, and neither study turns SSR into a timing tool.
What are the limits of SSR?#
- Stablecoins have many jobs. The US Treasury found them used mainly for trading, lending and borrowing digital assets [7]; the BIS points to cross-border payments as well [8]. Money parked in DeFi lending or used for payments is not necessarily waiting to buy bitcoin.
- Coverage choices. Glassnode counts “known and tracked” stablecoins [1]. Different providers track different coins and chains, so their SSR values differ.
- Concentration. The market is dominated by a few issuers. In a table retrieved from ethereum.org on 3 October 2026, USDT and USDC together made up about 90% of the ten largest stablecoins listed [2]. One issuer’s problems can move the whole denominator.
- Issuer events, not demand. Between 1 March and 1 April 2023, around the USDC de-peg, USDC’s market cap fell by about $9.7 billion while USDT’s rose by about $8.8 billion; Fed researchers describe USDT’s inflows in that period as potentially reflecting flight-to-safety dynamics [5]. Moves like these change stablecoin totals for reasons unrelated to bitcoin.
- Dollars only. Over 99% of stablecoins are US dollar-denominated [8], so SSR mostly compares Bitcoin with dollar stablecoins.
SSR in one box
- Formula
- BTC market cap ÷ stablecoin market cap [1]
- Created
- November 2019, by Renato Shirakashi [1]
- Low value means
- Stablecoins large relative to BTC [1]
- Stablecoin supply, October 2021
- $127.9 billion [7]
- US-dollar stablecoin supply, 3 October 2026 (DefiLlama)
- ≈ $312.8 billion [9]
- Measures purchases?
- No — it compares two market values
What mistakes do beginners make here?#
- Reading a low SSR as a buy signal
Glassnode reads a low SSR as more potential buying power, not intent. Many stablecoins sit in lending pools, payment flows or trades in other tokens.
- Ignoring which side of the ratio moved
A Bitcoin price drop lowers SSR just as stablecoin growth does. They mean very different things.
- Comparing SSR values from different providers
Each provider tracks a different list of stablecoins and chains. Compare within one source.
- Treating all stablecoins as equally solid
A stablecoin that loses its peg shrinks the denominator. Check the health of the largest issuers before reading the trend.
Frequently asked questions#
Who created the stablecoin supply ratio?
Glassnode credits Renato Shirakashi, who created it in November 2019 [1].
Is a lower SSR bullish?
Glassnode’s guide reads a low SSR as the stablecoin supply having more “buying power” to purchase BTC [1]. That describes potential demand, not a forecast: the guide makes no price prediction, and prices depend on many other factors. SSR is not a trading signal.
Why does SSR use market cap instead of the number of stablecoins?
For dollar stablecoins near $1, the two are almost the same. Market cap also handles the rare case where a coin trades well below $1, which reduces its real buying power.
Can SSR be calculated for Ether or other coins?
The same formula works with any asset’s market cap on top. Glassnode documents SSR for Bitcoin [1]; check each provider’s definition before comparing.
The bottom line#
SSR is a quick way to see how big the stablecoin pile is compared with Bitcoin. It is easy to calculate and easy to over-read: it moves with Bitcoin’s price, with issuer events and with how providers count stablecoins, and it says nothing about what stablecoin holders will actually do.
Pair it with flow metrics such as exchange netflow, and learn what the denominator is made of in what are stablecoins.
Sources#
Grade A = primary source (regulator, protocol specification, client code, original author). Grade B = expert secondary source used for explanation only.
- BGlassnode Docs (metric guides). SSR (Stablecoin Supply Ratio), 2026. Metric guide retrieved 3 October 2026.
- Aethereum.org. Stablecoins explained: What are they for?, 2026. Market-cap table retrieved 3 October 2026.
- ABoard of Governors of the Federal Reserve System. The stable in stablecoins (FEDS Notes), 2022.
- BDefiLlama documentation. Data Definitions, 2026.
- ABoard of Governors of the Federal Reserve System. Primary and Secondary Markets for Stablecoins (FEDS Notes), 2024.
- AEuropean Supervisory Authorities (EBA, ESMA, EIOPA). EU financial regulators warn consumers on the risks of crypto-assets, 2022.
- AU.S. Department of the Treasury — President’s Working Group on Financial Markets, FDIC and OCC. Report on Stablecoins (interagency report), 2021.
- ABank for International Settlements. Annual Economic Report 2025, Chapter III: The next-generation monetary and financial system, 2025.
- BDefiLlama (API data, summarised by TokenTrail). Stablecoins data: circulating supply of USD-pegged stablecoins, 2026. Snapshot retrieved 3 October 2026, 04:56 UTC.