Metrics library
- Realized cap: valuing coins at the price they last moved
- Realized price: the average price coins last moved at
- MVRV ratio: market value compared with realized value
- NVT ratio: network value compared with on-chain volume
- NUPL: how much paper profit or loss the network holds
- SOPR: are coins being spent at a profit or a loss?
- Percent supply in profit: how many coins are above water
- HODL waves: reading Bitcoin’s supply by coin age
- Coin Days Destroyed: measuring when old bitcoin starts to move
- Hash rate: how much work is securing Bitcoin
- Active addresses: counting who used the chain — roughly
- Puell Multiple: is miner income high or low compared with the past year?
- Exchange netflow: coins in minus coins out
- Stablecoin supply ratio (SSR): Bitcoin’s size against the stablecoin pile
- Funding rate: the price of staying long or short in perpetual futures
- Open interest: how much leveraged exposure is open right now
MVRV ratio: market value compared with realized value
MVRV divides what the market says a coin’s supply is worth today by what that supply was worth when it last moved. Above 1, the average coin sits on a paper gain; below 1, on a paper loss.

Photo: “Scales Weighing Gold (ca.1940) Robert” by nationalgalleryofart, CC0 1.0, via Rawpixel (edited: cropped and resized).
The MVRV ratio is market cap divided by realized cap [1]. Because realized cap approximates what holders paid, MVRV shows how far the market sits above or below that cost basis [2]. It describes the market; it is not a buy or sell signal.
Key points
- 1MVRV = market cap ÷ realized cap, which also equals price ÷ realized price.
- 2Above 1 means holders are on aggregate in paper profit; below 1, in paper loss.
- 3Thresholds such as 3.5 or 1 come from Glassnode’s reading of past Bitcoin cycles — conventions, not rules.
- 4Variants include the MVRV Z-score, free-float MVRV and short- and long-term holder MVRV.
What does the MVRV ratio measure?#
MVRV stands for market value to realized value. The market value is ordinary market capitalization: price times supply. The realized value is realized cap: every coin valued at the price on the day it last moved on-chain [1]. Glassnode frames the pair as the current value of the supply versus its cost basis [2].
Dividing one by the other gives a single number. Glassnode describes MVRV as a mean-reversion style model: realized cap plays the role of the long-run average, and MVRV measures how far the market has strayed from it [2]. Coin Metrics describes the idea as dividing a price measure by a “fundamental” to spot possible over- and undervaluation [1].
How is MVRV calculated?#
MVRV = Market cap ÷ Realized capCoin Metrics computes it as current-supply market cap divided by realized cap, as a dimensionless daily figure [1]. Since both caps use the same supply, MVRV also equals market price ÷ realized price.
| Step | Value |
|---|---|
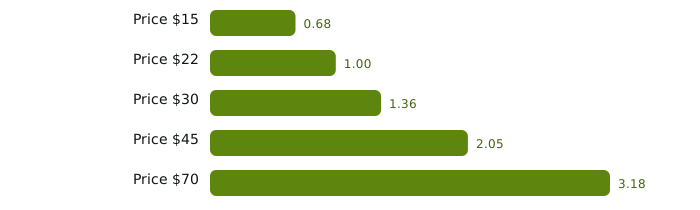
| Price $15 → market cap $15,000 ÷ $22,000 | MVRV 0.68 |
| Price $22 → market cap $22,000 ÷ $22,000 | MVRV 1.00 |
| Price $30 → market cap $30,000 ÷ $22,000 | MVRV 1.36 |
| Price $45 → market cap $45,000 ÷ $22,000 | MVRV 2.05 |
| Price $70 → market cap $70,000 ÷ $22,000 | MVRV 3.18 |
Realized cap was held fixed here to isolate the effect of price. In real markets coins also move, so realized cap shifts too — which is why MVRV can fall even on a day the price does not change.
Same coin, same realized cap, five prices

How do analysts read MVRV?#
| Reading | What it means arithmetically | How some analysts interpret it |
|---|---|---|
| MVRV above 1 | Supply is worth more than its on-chain cost | Holders sit on aggregate paper profit |
| MVRV rising | Price is pulling away from cost basis | More holders may be tempted to take profit, per Glassnode |
| MVRV above 3.5 | Supply worth over 3.5 times its cost basis | Glassnode: historically seen in late-stage bull cycles |
| MVRV below 1 | Supply worth less than its on-chain cost | Glassnode: historically seen near bear-market lows |
These readings come from Glassnode’s metric guide, which links high values to more unrealized profit and a higher chance that holders distribute coins, and values above 3.5 to past late-stage bull markets [2]. Coin Metrics adds that Bitcoin’s MVRV has dropped below 1 only a few times [1]. Both statements describe a handful of past Bitcoin cycles. That is a small sample, and neither provider claims the levels must repeat.
What are the MVRV Z-score and other variants?#
The MVRV Z-score takes the gap between market cap and realized cap and divides it by the standard deviation of market cap, so extremes are measured against the asset’s own history [4]. Glassnode credits it to an analyst known as Awe & Wonder, October 2018 [4]. With a hypothetical market-cap history of $10,000, $15,000, $25,000, $40,000 and $30,000 (standard deviation about $10,677), today’s gap of $8,000 gives a Z-score of about 0.75.
- Free-float MVRV (Coin Metrics) replaces market cap with free-float market cap, which leaves out supply held by insiders and long-term strategic holders [1].
- STH-MVRV and LTH-MVRV (Glassnode) compute MVRV only for coins younger than, or at least, 155 days old [5]. Glassnode describes the short-term version as hovering around 1 and the long-term version as swinging much more widely than plain MVRV [5].
- NUPL is closely linked: NUPL = (market cap − realized cap) ÷ market cap [6], which works out to 1 − 1 ÷ MVRV. See NUPL.
How can MVRV mislead?#
- It inherits realized cap’s blind spots. Every on-chain move is treated as a purchase, including self-transfers and change outputs [7]. A large exchange reshuffling old coins raises realized cap and pushes MVRV down without any trade.
- It cannot see off-chain trading. Coins bought and sold inside an exchange never touch the chain, so their prices never enter realized cap.
- Thresholds drift. Each cycle has a different mix of holders and products. A level that marked a past extreme may not be reached, or may be exceeded, next time.
- Data is revised. Glassnode warns that some historical on-chain values change after the fact, which can make back-tested thresholds look sharper than they were in real time [8].
MVRV in one box
Coin Metrics lists the metric as conceptualized by Adaptive Capital [1], and Glassnode’s further reading points to the original MVRV write-up published by Mahmudov and Puell on Adaptive Capital’s blog [2].
What mistakes do beginners make here?#
- Treating 3.5 or 1 as hard lines
They are historical conventions from Glassnode’s guide, not rules. Past cycles peaked and bottomed at different MVRV levels.
- Forgetting that realized cap moves too
MVRV can drop because old coins moved and raised realized cap, not only because the price fell.
- Comparing MVRV across coins
Different chains have different holder bases and lost-coin shares. Compare a coin’s MVRV with its own history.
- Confusing MVRV with the Z-score
The Z-score rescales the gap by market-cap volatility. Its numbers and thresholds are not interchangeable with plain MVRV.
Frequently asked questions#
Is MVRV a buy or sell signal?
No. MVRV tells you how far the market value sits above or below an estimate of what holders paid. The thresholds people quote are historical conventions from a few Bitcoin cycles, not rules, and past patterns do not have to repeat. Use it as background context, never as a timing tool.
What does an MVRV of 2 mean?
The coin supply is worth twice its estimated on-chain cost basis. In plain terms, the average coin shows a paper gain of about 100% since it last moved.
Can MVRV be negative?
No. Market cap and realized cap are both positive, so their ratio is always above zero. Values between 0 and 1 mean the average coin is at a paper loss.
Who invented the MVRV ratio?
Is MVRV useful for Ethereum?
Providers compute it for account-based chains using adapted last-movement rules [1], but the published thresholds were described for Bitcoin. Treat them with extra caution elsewhere.
The bottom line#
MVRV compares what a coin’s supply is worth now with what it was worth when it last moved. It is simple, it combines neatly with realized price and NUPL, and it gives useful context about how stretched the market is relative to on-chain cost.
Its weak points are inherited from realized cap and from a short history of cycles. Read it alongside NUPL, percent supply in profit and our guide to crypto market cycles — and never as a timing tool.
Sources#
Grade A = primary source (regulator, protocol specification, client code, original author). Grade B = expert secondary source used for explanation only.
- BCoin Metrics Data Knowledge Base. Market Capitalization (network data definitions), 2026.
- BGlassnode Docs. MVRV Ratio, 2026.
- AEuropean Supervisory Authorities (EBA, ESMA, EIOPA). EU financial regulators warn consumers on the risks of crypto-assets, 2022.
- BGlassnode Docs. MVRV-Z Score, 2026.
- BGlassnode Insights. Breaking up On-Chain Metrics for Short and Long Term Investors, 2020.
- BGlassnode Docs. NUPL (Net Unrealized Profit/Loss), 2026.
- ABitcoin Developer Documentation (developer.bitcoin.org). Transactions (developer guide), 2026.
- BGlassnode Docs. Point-in-Time Metrics, 2026.