Metrics library
- Realized cap: valuing coins at the price they last moved
- Realized price: the average price coins last moved at
- MVRV ratio: market value compared with realized value
- NVT ratio: network value compared with on-chain volume
- NUPL: how much paper profit or loss the network holds
- SOPR: are coins being spent at a profit or a loss?
- Percent supply in profit: how many coins are above water
- HODL waves: reading Bitcoin’s supply by coin age
- Coin Days Destroyed: measuring when old bitcoin starts to move
- Hash rate: how much work is securing Bitcoin
- Active addresses: counting who used the chain — roughly
- Puell Multiple: is miner income high or low compared with the past year?
- Exchange netflow: coins in minus coins out
- Stablecoin supply ratio (SSR): Bitcoin’s size against the stablecoin pile
- Funding rate: the price of staying long or short in perpetual futures
- Open interest: how much leveraged exposure is open right now
Puell Multiple: is miner income high or low compared with the past year?
The Puell Multiple compares what miners earned in new coins today, in dollars, with their average over the last 365 days. It is simple to calculate and easy to misread.

Photo: “Round Mountain gold mine” by Uncle Kick-Kick, CC BY-SA 2.0, via Flickr (edited: cropped and resized).
The Puell Multiple divides the US-dollar value of newly issued bitcoin on a given day by the 365-day moving average of that same daily value [1]. A value of 1 means miners’ issuance income is in line with its yearly average; 2 means double, 0.5 means half [2].
Key points
- 1It is a ratio of today’s miner issuance income (in dollars) to the one-year average of that income.
- 2Because the number of new coins per day is nearly fixed, the ratio mostly tracks the bitcoin price against its own one-year average.
- 3Each halving cuts the ratio roughly in half overnight, and the effect takes a year to wash out of the average.
- 4Data providers publish historical zones, but these are observations from a handful of cycles, not rules.
What does the Puell Multiple measure?#
Miners earn new coins with every block they find (see how Bitcoin mining works). Many must sell some of those coins to pay for hardware and electricity. Data providers therefore describe miners as “compulsory sellers” and look at their income as a window on the supply side of the market [3]. The Puell Multiple turns that idea into one number: is miners’ issuance income today high or low compared with the past year?
Glassnode, which documents the metric, describes it as an oscillator derived from miner profitability and income stress, and credits its creation to David Puell in March 2019 [1]. Strictly speaking it measures income, not profit: miners’ costs do not appear anywhere in the formula.
How is the Puell Multiple calculated?#
Puell Multiple = daily issuance value (USD) ÷ 365-day moving average of daily issuance value (USD)Daily issuance value = new coins created that day × the price. The 365-day moving average is the mean of that daily value over the past year [1].
On Bitcoin, the new coins are the block subsidy: 3.125 BTC per block since the 2024 halving [4]. The difficulty adjustment keeps blocks near 144 a day, so roughly 450 new BTC enter circulation daily. Glassnode notes that the difficulty adjustment keeps issuance roughly the same regardless of how much hash power is mining [1]. That has an important consequence: with the coin count almost fixed, day-to-day changes in the Puell Multiple come mostly from the price.
| Version | What counts as income | Computed as |
|---|---|---|
| Coinbase issuance (closest to the original) | New coins from the protocol’s emission schedule only | IssContUSD ÷ ma365(IssContUSD) |
| Total issuance | All new issuance | IssTotUSD ÷ ma365(IssTotUSD) |
| Revenue | The USD value of miner revenue | RevUSD ÷ ma365(RevUSD) |
Definitions from Coin Metrics’ supply-issuance and miner-revenue documentation [2] [3]. Check which version a chart uses before comparing numbers.
The block reward a miner collects is the subsidy plus transaction fees [5]. The classic Puell Multiple is built on new-coin issuance, so a period of unusually high fees does not show up in it. Coin Metrics’ revenue version is based on miner revenue instead [3].
| Step | Value |
|---|---|
| New BTC issued today (144 blocks × 3.125) | 450 BTC |
| Bitcoin price today (hypothetical) | $60,000 |
| Daily issuance value = 450 × $60,000 | $27.0 million |
| 365-day average of daily issuance value (hypothetical) | $18.0 million |
| Puell Multiple = 27.0 ÷ 18.0 | 1.5 |
| Same day if the price were $120,000 | 3.0 |
Doubling the price doubles the numerator straight away, while the one-year average barely moves. That is why the multiple spikes during fast price rallies and sinks during sharp falls.
How do analysts read the Puell Multiple?#
The common reading is about pressure on miners. Glassnode frames high values as periods when miner profitability is high relative to the yearly average and miners have more incentive to sell, and low values as periods of income stress when some miners may switch off machines [1]. Some chart providers go further and present the high and low bands as signals for when to sell or buy [6]. We treat that as a hypothesis, not a finding.
| Puell Multiple | What Glassnode reports | Caution |
|---|---|---|
| Above 4.0 | Has historically coincided with macro market tops; early cycles reached 6–10 | Early-cycle peaks were much higher, so any fixed line has moved over time |
| Around 1.0 | Issuance income in line with the yearly average | Neutral by construction |
| Below 1.0 | Miners are likely experiencing income stress | Also happens mechanically for a year after every halving |
| Below 0.5 | Significant macro bottoms have historically formed here | A handful of past cycles is a very small sample |
Levels from Glassnode’s metric guide [1].
Why does a halving drag the Puell Multiple down?#
On the day of a halving, issuance per block halves, so the numerator halves. The 365-day average, however, is still full of pre-halving days. Glassnode points out that a halving therefore produces an immediate halving of the Puell Multiple too [1]. The ratio then climbs back slowly as post-halving days replace pre-halving days in the average.
Puell Multiple after a halving, if the price never moved
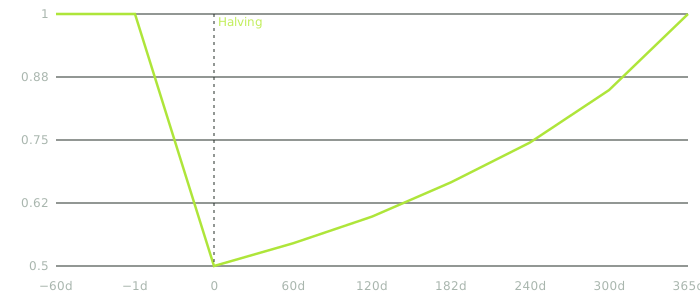
So a reading of, say, 0.6 four months after a halving says less about miner stress than the same reading in the middle of an era. Compare readings within the same halving era, or check how the price has moved against its own one-year average.
What are the limits of the Puell Multiple?#
- It is mostly a price ratio. With issuance nearly fixed, it largely reflects price versus its 365-day average.
- It ignores costs. Two miners with the same income can have very different electricity prices and machines.
- It ignores fees in its classic form. Fees are part of the block reward but not of issuance; a revenue-based version exists if fees matter for the period you study [3].
- Miner behaviour is inferred, not observed. The story about miners selling more at highs and less at lows is an interpretation of incentives.
- It only applies to coins with mining issuance. Proof-of-stake networks have no miners and need different measures.
Pair it with hash rate, which shows whether miners are actually switching machines off, and with valuation measures such as the MVRV ratio, which compare price with on-chain cost basis rather than with miner income.
Puell Multiple in one box
What mistakes do beginners make here?#
- Calling every low reading a bottom
For a year after each halving, the multiple is pulled down mechanically. A low value then may only reflect the halving.
- Mixing versions
Issuance-based and revenue-based versions give different numbers. Compare like with like.
- Reading it as miner profit
It measures income in dollars. Profit depends on costs that the metric never sees.
- Using fixed thresholds as signals
Levels such as 4.0 or 0.5 are historical observations from a few cycles and have shifted over time.
Frequently asked questions#
Who created the Puell Multiple?
Does the Puell Multiple include transaction fees?
Why 365 days?
Glassnode says the yearly window is meant to reflect a baseline income in line with a miner’s long-term investment and planning horizon [1].
Can I use it for Ethereum?
Not today. Ethereum completed its move from proof-of-work to proof-of-stake with The Merge on 15 September 2022, so it no longer has miners or mining issuance to measure [8].
The bottom line#
The Puell Multiple is a quick way to see whether miners’ dollar income from new coins is running above or below its one-year norm. Because issuance is almost fixed, it mostly tells you how far the price has moved from its own yearly average — and every halving knocks it down for a year.
Use it as context alongside hash rate and the halving schedule, not as a buy or sell signal.
Sources#
Grade A = primary source (regulator, protocol specification, client code, original author). Grade B = expert secondary source used for explanation only.
- BGlassnode Docs. Puell Multiple (metric guide), 2026.
- BCoin Metrics Data Knowledge Base. Supply Issuance (Puell Multiple, Coinbase Issuance and Total Issuance), 2026.
- BCoin Metrics Data Knowledge Base. Miner Revenue (Puell Multiple, Revenue), 2026.
- BBitcoin Wiki. Controlled supply, 2026.
- Abitcoin.org developer documentation. Bitcoin Developer Glossary: Block reward, 2026.
- BLook Into Bitcoin (formerly Bitcoin Magazine Pro). The Puell Multiple, 2026.
- AEuropean Supervisory Authorities (EBA, ESMA, EIOPA). EU financial regulators warn consumers on the risks of crypto-assets, 2022.
- Aethereum.org. The Merge, 2026.