Metrics library
- Realized cap: valuing coins at the price they last moved
- Realized price: the average price coins last moved at
- MVRV ratio: market value compared with realized value
- NVT ratio: network value compared with on-chain volume
- NUPL: how much paper profit or loss the network holds
- SOPR: are coins being spent at a profit or a loss?
- Percent supply in profit: how many coins are above water
- HODL waves: reading Bitcoin’s supply by coin age
- Coin Days Destroyed: measuring when old bitcoin starts to move
- Hash rate: how much work is securing Bitcoin
- Active addresses: counting who used the chain — roughly
- Puell Multiple: is miner income high or low compared with the past year?
- Exchange netflow: coins in minus coins out
- Stablecoin supply ratio (SSR): Bitcoin’s size against the stablecoin pile
- Funding rate: the price of staying long or short in perpetual futures
- Open interest: how much leveraged exposure is open right now
Realized price: the average price coins last moved at
Realized price turns realized cap into a per-coin number you can put on a price chart. It is an average of on-chain purchase prices — useful, but only as good as the assumptions behind it.
Photo: “Account book of Aholiab Johnson” by Yale Law Library, CC BY 2.0, via Flickr (edited: cropped and resized).
Realized price is realized cap divided by the number of coins in circulation [1]. It estimates the average price at which today’s coins last moved on-chain. When the market price sits above it, holders are on aggregate in paper profit; below it, on aggregate in paper loss [1].
Key points
- 1Realized price = realized cap ÷ circulating supply.
- 2It is an average cost per coin, built on the assumption that every on-chain move is a purchase.
- 3Market price divided by realized price gives exactly the MVRV ratio.
- 4An average hides the spread: two markets with the same realized price can look very different underneath.
What is realized price?#
Realized price is a per-coin version of realized cap. Realized cap values each coin at the price on the day it last moved on-chain and adds everything up [2]. Divide that total by the number of coins in circulation and you get an average: roughly what the current holders paid per coin, if every movement were a purchase [1].
That “if” matters. Look Into Bitcoin, which publishes a realized price chart, states openly that the method treats a move from one wallet to another as coins being bought [1]. In reality many moves are owners shuffling their own coins. Keep that in mind every time you see realized price described as “the market’s cost basis”.
How is realized price calculated?#
Realized price = Realized cap ÷ Coins in circulationRealized cap sums every coin at the price of its last on-chain move [2]; dividing by supply turns that total into an average price per coin [1].
| Step | Value |
|---|---|
| Realized cap: 400 × $5 + 300 × $20 + 200 × $40 + 100 × $60 | $22,000 |
| Realized price: $22,000 ÷ 1,000 coins | $22 |
| Market price $30 → price ÷ realized price | 1.36 (holders on aggregate in profit) |
| Market price $15 → price ÷ realized price | 0.68 (holders on aggregate at a loss) |
| Wallet A’s 400 coins move at $30: new realized cap $32,000 ÷ 1,000 | $32 |
In the last line the market price stayed at $30, yet realized price jumped from $22 to $32 and the market price is now below it. Nothing was necessarily sold — cheap coins simply moved and were re-priced.
What does price above or below realized price mean?#
The comparison is simple arithmetic. If the market price is above realized price, the average coin is worth more today than when it last moved, so holders are on aggregate in paper profit. If the market price is below it, holders are on aggregate holding paper losses [1]. Look Into Bitcoin notes that periods with Bitcoin trading below realized price have historically lined up with major cycle lows [1] — a historical observation from one chart provider, not a rule.
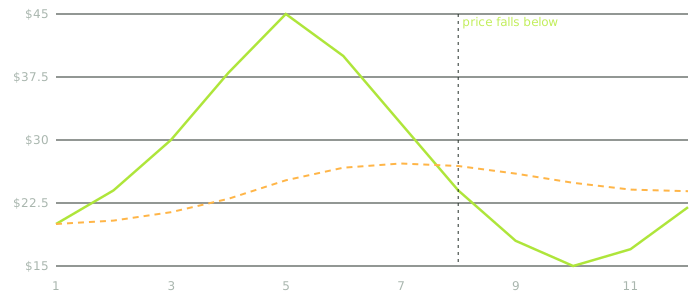
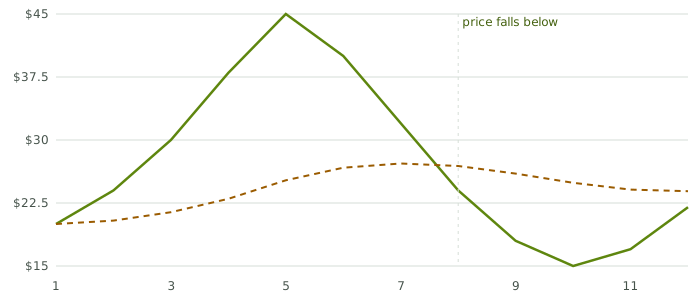
Price swings fast, realized price drifts slowly
| What you see | What it means arithmetically | What it does not tell you |
|---|---|---|
| Price well above realized price | The average coin shows a paper gain | Whether holders will sell, or when |
| Price near realized price | Average holder is near break-even | That a “floor” exists at this level |
| Price below realized price | The average coin shows a paper loss | That the bottom is in |
| Realized price rising | Coins are moving at higher prices than before | That new money necessarily entered |
Price divided by realized price is exactly the MVRV ratio, because both market cap and realized cap share the same supply figure [2]. Realized price is simply the chart-friendly way to show the same relationship: one line for price, one for average on-chain cost.
Why can an average cost basis mislead?#
An average hides the spread. Glassnode’s URPD chart shows how many existing bitcoins last moved within each price bucket [3], which reveals what one average cannot. Picture two hypothetical coins, both with a realized price of $22 and a market price of $30. In the four-wallet ledger above, 70% of coins are in profit, because 300 coins last moved at $40 or $60. If instead all 1,000 coins had last moved at exactly $22, 100% would be in profit. Same average, different market.
- Moves are treated as purchases. Self-transfers, exchange reorganisations and change outputs all reset prices [4].
- Lost coins drag the average down. Coins untouched for many years sit in the average at very old prices [2].
- Cohorts behave differently. Glassnode separates short-term and long-term holders at 155 days of coin age, because younger coins are much more likely to be spent [5]. A single average blends both groups.
- It is not a support level. Calling realized price a “floor” is an interpretation. Prices can and have fallen below it.
Are there short-term and long-term versions?#
Yes, in effect. Glassnode builds short-term and long-term holder versions of MVRV by including only coins younger than, or at least, 155 days old [5]. Since MVRV equals price divided by realized price, each version is comparing today’s price with the average on-chain cost of that group of coins. Glassnode says the short-term version removes long-term trends from the original MVRV signal, making it better suited to short time frames [5]. Read more in long-term vs short-term holders.
Realized price in one box
- Formula
- Realized cap ÷ coins in circulation [1]
- Key assumption
- An on-chain move counts as a purchase at that day’s price [1]
- Price used (Coin Metrics realized cap)
- USD daily close on the day of last movement [2]
- Holder split used by Glassnode
- 155 days of coin age [5]
- Price ÷ realized price
- Equals the MVRV ratio [2]
What mistakes do beginners make here?#
- Treating it as a floor
Price has traded below realized price before. It is a reference line, not a level the market must respect.
- Forgetting the purchase assumption
Realized price assumes every move is a buy. Wallet housekeeping and exchange transfers distort it.
- Trusting one average
The same realized price can hide a tight cluster or a wide spread of purchase prices. Look at a distribution chart before drawing conclusions.
- Mixing up realized price and your own cost
Realized price is a network-wide estimate. Your personal break-even depends only on what you paid, including fees.
Frequently asked questions#
Is realized price the same as the average purchase price of bitcoin?
It is an estimate of it. It uses the price at each coin’s last on-chain move, and treats that move as a purchase [1]. Trades that happen inside exchanges never touch the chain, so they are not reflected.
Why does realized price change when price is flat?
Because coins keep moving. Every move re-prices those coins at the current price, which pulls realized price towards the market price over time.
How is realized price related to MVRV?
Market price divided by realized price equals the MVRV ratio, since both caps use the same supply [2].
Can I use realized price for altcoins?
Only where a provider has reliable last-move data. Fully private coins such as Monero are not covered by Coin Metrics’ realized cap at all [2].
The bottom line#
Realized price is realized cap divided by supply — an average on-chain cost per coin. Comparing it with the market price tells you whether the average holder is in paper profit or loss, and that comparison is exactly the MVRV ratio.
Its weaknesses come from its assumptions: moves are not always purchases, lost coins drag the average, and an average hides the spread. For a deeper walk-through, read realized price and cost basis and the supply in profit profile.
Sources#
Grade A = primary source (regulator, protocol specification, client code, original author). Grade B = expert secondary source used for explanation only.
- BLook Into Bitcoin. Realized Price, 2026.
- BCoin Metrics Data Knowledge Base. Market Capitalization (network data definitions), 2026.
- BGlassnode Docs. URPD (UTXO Realized Price Distribution), 2026.
- ABitcoin Developer Documentation (developer.bitcoin.org). Transactions (developer guide), 2026.
- BGlassnode Insights. Breaking up On-Chain Metrics for Short and Long Term Investors, 2020.
- AEuropean Supervisory Authorities (EBA, ESMA, EIOPA). EU financial regulators warn consumers on the risks of crypto-assets, 2022.