On-Chain Analysis

How analysts turn public ledger data into cost-basis, holder and flow signals — and where that reasoning breaks down.

Metrics and terms for this topic

Stacks and piles of gold-coloured coins
Metric· 7 min read

Realized cap: valuing coins at the price they last moved

Market cap prices every coin at today’s price. Realized cap prices each coin at the moment it last changed hands on-chain — which turns it into a rough record of what the market collectively paid.

8 sources · 3 primary
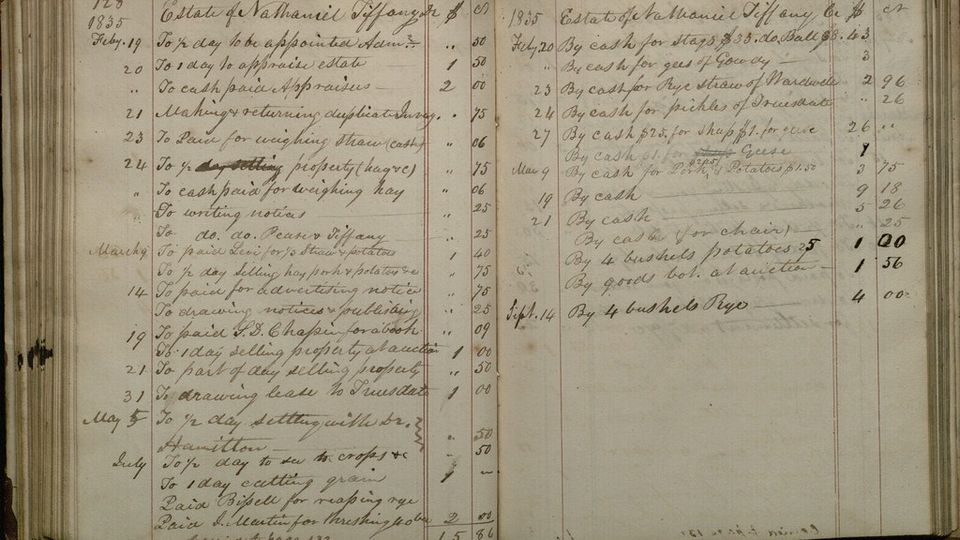
Open handwritten account book with columns of dated entries and sums
Metric· 5 min read

Realized price: the average price coins last moved at

Realized price turns realized cap into a per-coin number you can put on a price chart. It is an average of on-chain purchase prices — useful, but only as good as the assumptions behind it.

6 sources · 2 primary
Antique brass balance scale on a white background
Metric· 6 min read

MVRV ratio: market value compared with realized value

MVRV divides what the market says a coin’s supply is worth today by what that supply was worth when it last moved. Above 1, the average coin sits on a paper gain; below 1, on a paper loss.

8 sources · 2 primary
Aerial view of a container port packed with shipping containers
Metric· 5 min read

NVT ratio: network value compared with on-chain volume

NVT asks how much the market values a network for each dollar it moves on-chain in a day. It was pitched as crypto’s version of a price-to-earnings ratio — with the same kind of caveats, and a few new ones.

8 sources · 3 primary
Close-up of old cash register keys
Metric· 5 min read

SOPR: are coins being spent at a profit or a loss?

SOPR looks only at coins that actually moved in a period and compares what they were worth when spent with what they were worth when created. It reads realized results, not paper ones.

9 sources · 2 primary
Waves rolling in and breaking on a beach
Metric· 6 min read

HODL waves: reading Bitcoin’s supply by coin age

HODL waves stack Bitcoin’s supply into coloured bands by how long ago each coin last moved. The bands swell and shrink as holders sit still or spend, and the result looks like waves.

9 sources · 4 primary

Other topics

Tightly packed links of heavy metal chain
Topic

Blockchain Basics

Blocks, transactions, keys and fees: the moving parts every other topic builds on.

Tall stacks of gold-coloured coins on a dark table
Topic

Bitcoin

Supply schedule, mining, difficulty, Lightning and spot ETFs.

Three-dimensional rendering of the blue Ethereum diamond logo
Topic

Ethereum

Accounts, gas, staking, the fee burn and layer-2 rollups.

Uncut sheet of US one-hundred-dollar banknotes
Topic

DeFi & Stablecoins

Stablecoins, exchanges without order books, liquidity pools and on-chain lending.

Busy trading hall of an exchange seen from the gallery
Topic

Market Structure

Spot versus derivatives, funding rates, open interest, liquidations and order books.

Silhouette of a roller coaster's loops against a cloudy sky
Topic

Investing Fundamentals

Risk, volatility, diversification, position sizing and market cycles for crypto beginners.

Rows of numbered safe-deposit boxes along a vault wall
Topic

Security & Scams

Custody choices, seed phrases, hardware wallets and the scams that target new users.

What will you learn about on-chain analysis here?

Every transaction on a public blockchain is recorded where anyone can read it. On-chain analysis is the practice of turning that record into numbers: an estimate of what holders paid, how long coins have sat still, how much is moving to and from exchanges. The data is exact about movements, but it says nothing directly about who owns an address or why coins moved, so every metric rests on assumptions. This section explains how the main measures are built and, just as carefully, what they cannot tell you. Thresholds you see quoted for these metrics are conventions analysts use, not rules.

Where should you start?#

It helps to know how a Bitcoin transaction spends earlier outputs before you begin. Then read in this order:

  1. What is on-chain analysis? — reading the public ledger, and what the numbers can and cannot prove.
  2. Realized price explained — estimating what holders paid, worked through with numbers.
  3. Long-term vs short-term holders — where the dividing line comes from, and how far to trust it.
  4. Exchange inflows and outflows — reading coins moving to and from exchange wallets.
  5. UTXO vs account model — two ways a blockchain keeps score, and what each lets analysts measure.
  6. On-chain data limitations — the blind spots every beginner should know.

How does this topic connect to the rest of the site?#

Each guide leads into the metrics library, where indicators have their own profiles with formulas, origins and limits. Good places to begin are realized cap, the MVRV ratio, SOPR and exchange netflow. The UTXO and whale glossary entries define two terms that come up constantly.

Frequently asked questions#

Can on-chain metrics predict the price?

No metric can tell you what the price will do next. Metrics describe what has already happened on the chain, under assumptions about which addresses belong to whom. The limits guide lists the blind spots, and crypto market cycles explains why none of this lets you time the market.

Do I need to read code to follow these guides?

No. Each guide explains its metric in plain English and works through small examples with the arithmetic shown. Some background on blocks and transactions from Blockchain Basics makes the guides easier to follow.