Exchange inflows and outflows: how to read coins moving to and from exchanges
Exchange flow charts track coins arriving at and leaving wallets that analysts believe belong to exchanges. The arithmetic is simple; knowing which wallets are exchanges is the hard part.

Photo: “20120720-NRCS-LSC-1490” by USDAgov, Public Domain Mark 1.0, via Flickr (edited: cropped and resized).
An exchange inflow is coins sent to an address identified as belonging to an exchange; an outflow is coins leaving such an address; netflow is inflow minus outflow [1]. Because exchange addresses are identified by labels and clustering, balances are best read as lower-bound estimates that can be revised [2].
Key points
- 1Flows are measured only for addresses a data provider has identified as exchange-owned.
- 2Netflow = inflow − outflow. A positive number means more coins arrived than left that day.
- 3Exchange balance figures are usually underestimates and can be revised when new addresses are found.
- 4Why coins moved is never recorded. Selling, collateral, custody changes and internal shuffles can all look alike.
On this page
- What counts as an exchange inflow or outflow?
- How is exchange netflow calculated?
- How do analysts usually read inflows and outflows?
- Why are exchange balances only estimates?
- How should a beginner use exchange flow charts?
- What mistakes do beginners make here?
- Frequently asked questions
- The bottom line
- Sources
What counts as an exchange inflow or outflow?#
Centralised exchanges hold customers’ coins in their own wallets: deposit addresses, hot wallets for day-to-day withdrawals and cold wallets for storage. When you deposit bitcoin, you send it to an address the exchange controls. That on-chain transfer is visible to everyone — but nothing on the blockchain says “this address belongs to Exchange X.”
Data providers therefore build lists of exchange addresses. Coin Metrics counts coins as sent to an exchange when they go to an address it identifies as exchange-owned, and as withdrawn when they leave the control of such an address [1]. Glassnode describes three ways of finding those addresses: addresses verified by exchanges (for example in proof-of-reserves disclosures), public address tags checked for quality, and clustering algorithms that keep extending the label set [2].
How is exchange netflow calculated?#
Netflow = Inflow − Outflow Netflow (USD) = Netflow (coins) × priceCoin Metrics computes the dollar version by multiplying the native-unit netflow by the daily price, and publishes one value per day for each exchange it covers [1].
For Bitcoin there is a subtlety. A single transaction can both withdraw from and deposit to the same exchange — for instance when change goes back to an exchange wallet. Coin Metrics nets these inside the transaction: if a transaction sends 90 BTC to exchange A and also withdraws 50 BTC from it, the flow is recorded as +40 BTC, not as +90 and −50 [1]. Change outputs exist because Bitcoin outputs must be spent in full [3]; see the netflow metric profile for more detail.
| Step | Value |
|---|---|
| Mon: 1,200 in − 1,000 out | +200 BTC |
| Tue: 950 in − 1,300 out | −350 BTC |
| Wed: 1,800 in − 900 out | +900 BTC |
| Thu: 700 in − 1,500 out | −800 BTC |
| Fri: 2,100 in − 800 out | +1,300 BTC |
| Sat: 600 in − 1,600 out | −1,000 BTC |
| Sun: 900 in − 1,100 out | −200 BTC |
| Week: 8,250 in − 8,200 out | +50 BTC |
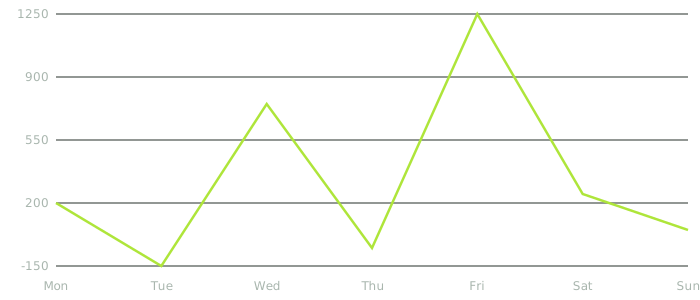
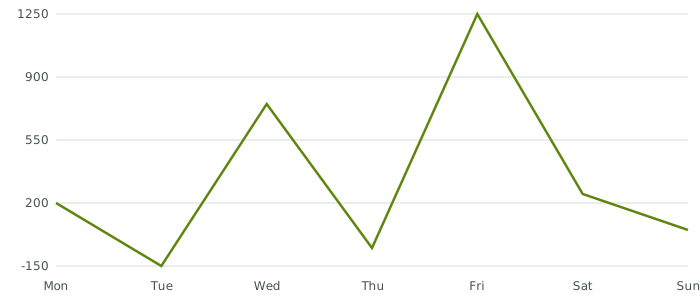
Daily netflow swung between −1,000 and +1,300 BTC, yet the week netted to just +50 BTC. Single days are noisy; a running total says more about the direction of travel.
Running total of the hypothetical week’s netflow
How do analysts usually read inflows and outflows?#
There is no rule linking flows to price, only common interpretations. The most widespread is a hypothesis about intent: coins usually need to be on an exchange to be sold there, so sustained net inflows are often read as supply being made available for sale, and sustained net outflows as coins moving into self-custody. Treat that as a starting hypothesis to test, not a fact the data proves.
| What you see | Common reading | Other possible explanations |
|---|---|---|
| Large net inflow | Holders preparing to sell | Collateral for derivatives, an exchange consolidating wallets, a newly labelled address |
| Large net outflow | Coins moving to self-custody | Exchange moving reserves to an unlabelled cold wallet, transfers to a custodian |
| Exchange balance falling for months | Less supply readily available to trade | Incomplete labels; activity shifting to exchanges the provider does not cover |
| One huge spike | A whale moved | Internal reshuffle the algorithms have not yet recognised |
Glassnode itself warns that early signs such as a significant inflow or outflow should be approached with caution, because exchanges can change addresses and reshuffle funds internally, and some of these events cannot be detected straight away [2].
Why are exchange balances only estimates?#
Everything depends on the address list. Coin Metrics says its exchange supply figures should be seen as an underestimate, because its heuristics and sources might not discover every address an exchange owns [4]. Glassnode says its balances can largely be considered lower bounds, since it tries to avoid falsely labelling non-exchange addresses [2].
- Coverage gaps. Providers only track the exchanges and chains they support; Coin Metrics withholds a metric when it judges its coverage of an exchange incomplete [1].
- Retroactive revisions. When a new exchange address is found, past balances can be recalculated. Glassnode recommends its point-in-time data for anyone who needs values that never change [2].
- Disclosure differs by exchange. Accuracy is better where an exchange publishes verified addresses; Glassnode’s own table shows that many exchanges do not [2].
- Assets only, not liabilities. On-chain balances say nothing about what an exchange owes its customers [2].
How should a beginner use exchange flow charts?#
- Check the coverage
Which exchanges and chains are included? An “all exchanges” line only covers the exchanges that provider tracks.
- Look at totals over weeks
Use a running total or a 7-day sum rather than a single day’s netflow.
- Compare with exchange balance
Netflow and the change in exchange balance should tell the same story. If they do not, a relabelling may be involved.
- Ask what else could explain it
List the non-selling reasons for the flow before accepting the selling story.
- Keep it descriptive
Say “coins left labelled exchange wallets”, not “investors are bullish”. The second is an opinion.
Exchange flows at a glance
What mistakes do beginners make here?#
- Treating one day’s inflow as a sell signal
Single-day spikes are often internal reshuffles or relabellings. Look at multi-week totals.
- Assuming the provider sees every exchange
Coverage is limited to tracked exchanges, and exchange balances are underestimates by design.
- Confusing on-chain flows with trading volume
Trades inside an exchange never touch the blockchain. Flows only show deposits and withdrawals.
- Mixing providers in one comparison
Each provider has its own address list. Compare a series with its own history, not with another provider’s numbers.
Frequently asked questions#
Is a positive netflow bearish?
Not necessarily. It means more coins arrived at labelled exchange addresses than left them. That can precede selling, but it can also reflect collateral deposits or wallet reshuffles.
Why did yesterday’s exchange balance change after the fact?
Providers add newly identified exchange addresses and recalculate history. Glassnode notes that exchange balances may be revised retrospectively [2].
Do exchange flows include stablecoins?
Some providers publish flows for tokens as well as native coins, but coverage varies by asset, chain and exchange. Check the methodology page for the specific chart.
Can I see flows for my own exchange account?
Your deposit and withdrawal transactions are on-chain, but aggregate flow charts mix them with every other customer’s. They cannot show any individual account.
The bottom line#
Exchange flows answer a narrow question — how many coins arrived at and left wallets believed to belong to exchanges — and they answer it with estimated labels. Used over weeks rather than days, and alongside the reasons coins might move for non-trading purposes, they can describe how supply is shifting. They do not reveal intentions.
For the exact definitions, read the exchange netflow profile, and for the bigger picture of what labels can and cannot do, see the limits of on-chain data.
Sources#
Grade A = primary source (regulator, protocol specification, client code, original author). Grade B = expert secondary source used for explanation only.
- BCoin Metrics Data Knowledge Base. Net Flows (exchange metrics), 2026.
- BGlassnode Docs. Exchange Data Transparency Notice, 2026.
- Abitcoin.org developer documentation. Developer Guide: Transactions, 2026.
- BCoin Metrics Data Knowledge Base. Exchange Supply (exchange metrics), 2026.
Keep reading
CEX vs DEX: how centralized and decentralized crypto exchanges differ
A centralized exchange is a company that holds your funds and matches orders for you. A decentralized exchange is a set of smart contracts you trade against from your own wallet. Each removes some risks and adds others.
Custodial vs non-custodial wallets: who really holds your crypto?
With a custodial account a company holds the keys and you trust it. With self-custody you hold the keys and carry the responsibility. Here is what changes, risk by risk.

On-chain data limitations: seven blind spots every beginner should know
Blockchain data is exact about movements and silent about people, motives and anything that happens off the chain. Knowing the blind spots is what separates careful analysis from chart-reading.