Drawdown recovery math: why a 50% loss needs a 100% gain
A drawdown is the fall from a peak to a low. The arithmetic of getting back is lopsided, and it gets worse the deeper the fall. Here is the math, with tables and worked examples.

Photo: “Mountains Valley” by sbmeaper1, CC0 1.0, via Flickr (edited: resized).
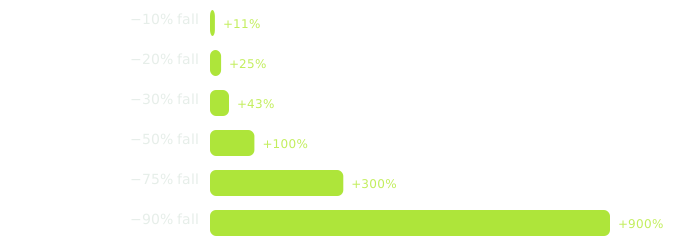
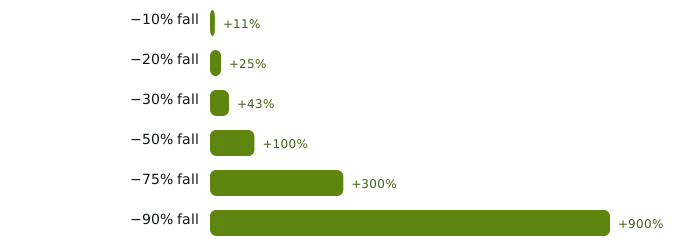
A drawdown is the percentage fall from a peak. To recover a fall of d%, you need a gain of d ÷ (100 − d) × 100%: +25% after −20%, +100% after −50%, +900% after −90%. Gains are measured from the lower value, so losses and gains do not cancel.
Key points
- 1A drawdown measures the fall from the highest value so far, not from what you paid.
- 2The gain needed to recover grows much faster than the loss: twice the loss at −50%, ten times at −90%.
- 3Time to recover depends on future returns nobody knows; any estimate is an illustration.
- 4Equal ups and downs leave you behind — this is volatility drag.
- 5Leverage multiplies drawdowns and can wipe out an account on a fall that an unleveraged holder survives.
On this page
- What is a drawdown?
- Why does a 50% loss need a 100% gain?
- How do you measure the largest drawdown?
- How long could a recovery take?
- What is volatility drag?
- How does leverage change drawdowns?
- How can you limit drawdowns before they happen?
- What mistakes do beginners make here?
- Frequently asked questions
- The bottom line
- Sources
What is a drawdown?#
A drawdown is how far a value has fallen from its most recent peak, as a percentage of that peak. If your holding rose to $2,000 and is now worth $1,500, you are in a 25% drawdown — even if you originally paid $1,000. The maximum drawdown is the largest such fall over a period, and it is one of the simplest ways to describe how painful an investment has been to hold.
Drawdowns are related to two market terms defined by the CFTC: a correction is a temporary decline during a bull market that partly reverses the previous rally, and a bear market is a market in which prices generally decline over months or years [1]. In crypto, deep drawdowns are not rare events. EU regulators warn that many crypto-assets are subject to sudden and extreme price movements, and that you may lose a large amount or even all of the money you invest [2].
Why does a 50% loss need a 100% gain?#
Because a percentage gain is measured from the new, lower value. Lose half of $1,000 and you have $500. A 50% gain on $500 is $250, which takes you to $750 — not back to $1,000. To return to $1,000, the $500 has to double.
Gain needed (%) = (1 ÷ (1 − d) − 1) × 100, where d = drawdown as a decimalAfter a fall of d, the value is (1 − d) of the peak. Multiplying it by 1 ÷ (1 − d) brings it back to the peak; subtract 1 and convert to a percentage. This is the same formula our drawdown recovery calculator uses.
| Fall from peak | Value left per $100 | Gain needed | Value must multiply by |
|---|---|---|---|
| 10% | $90 | +11.11% | 1.111× |
| 20% | $80 | +25% | 1.25× |
| 30% | $70 | +42.86% | 1.429× |
| 50% | $50 | +100% | 2× |
| 75% | $25 | +300% | 4× |
| 90% | $10 | +900% | 10× |
| 95% | $5 | +1,900% | 20× |
Gain needed to get back to the peak
How do you measure the largest drawdown?#
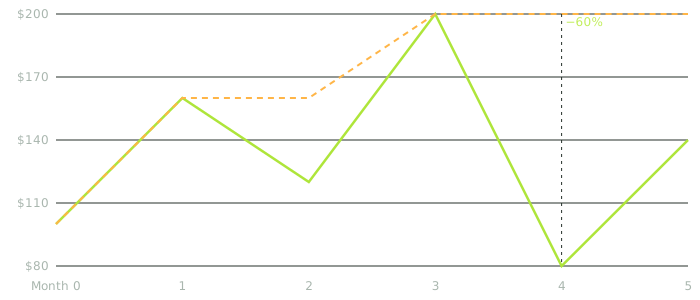
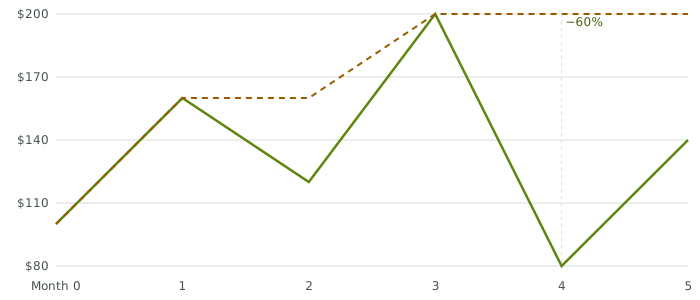
Track the highest value reached so far (the running peak). On each date, the drawdown is the fall from that peak. The maximum drawdown is the biggest of those falls. Here is a hypothetical price path:
A hypothetical price path and its running peak
| Step | Value |
|---|---|
| Month 2: fall from $160 peak to $120 | −25% |
| Month 4: fall from $200 peak to $80 | −60% (the maximum drawdown) |
| Month 5: $140 vs the $200 peak | still −30% |
| Gain needed from $80 to get back to $200 | +150% |
| Gain needed from $140 to get back to $200 | +42.86% |
At month 5 the price is up 40% from the start, yet anyone who bought at month 3 is still 30% under water. A drawdown depends on when you started looking — which is why the same asset can feel like a success to one holder and a disaster to another.
How long could a recovery take?#
Nobody knows, because it depends on future returns. What arithmetic can do is show how long a recovery would take if the asset grew at a steady rate afterwards. That uses compound growth — returns earned on previous returns — which the SEC’s compound interest calculator illustrates [3].
Years to recover = ln(1 ÷ (1 − d)) ÷ ln(1 + r), where r = assumed yearly returnThis finds how many years of compounding at r are needed to multiply the value by 1 ÷ (1 − d).
| Fall from peak | At +10% a year | At +20% a year |
|---|---|---|
| 20% | 2.3 years | 1.2 years |
| 50% | 7.3 years | 3.8 years |
| 75% | 14.5 years | 7.6 years |
| 90% | 24.2 years | 12.6 years |
The 10% and 20% rates are assumptions for illustration, not forecasts. Real returns are never steady, and an asset may never recover.
What is volatility drag?#
Volatility drag is the loss that comes from swings themselves. Because each percentage move applies to a different starting value, equal ups and downs do not cancel. The bigger the swings, the bigger the drag.
| Step | Value |
|---|---|
| +50% then −50% = $100 × 1.5 × 0.5 | $75 |
| −50% then +50% = $100 × 0.5 × 1.5 | $75 |
| Ten rounds of +10% then −10% | $90.44 |
| Ten rounds of +30% then −30% | $38.94 |
In every row the average move is zero, yet money is lost — and the larger swings lose far more. This is one reason high volatility is costly even when prices go nowhere.
How does leverage change drawdowns?#
Leverage multiplies the effect of each price move on your own money. The CFTC warns that when markets move against a leveraged position, traders must add money or close out, and may in the end lose more than their initial investment [6]. With 3× leverage, a 30% price fall is a 90% fall in your own capital — a hole that needs a +900% gain to climb out of. A fall of about 33% would erase it entirely. See leverage and open interest and liquidations.
How can you limit drawdowns before they happen?#
Once a drawdown has happened, the arithmetic above is fixed. The useful decisions come earlier.
- Size for the worst case
Only put at risk money you can afford to lose entirely [5]. If a 90% fall would hurt your life, the position is too big.
- Decide your exit in advance
Pick the price at which you would sell and size the position to it; the position size calculator does the arithmetic.
- Spread risk across different assets
Holding asset categories that do not all move together can reduce the risk of large losses [7].
- Rebalance
Trimming a holding that has grown large means a later fall hits a smaller amount.
- Avoid leverage
It turns survivable drawdowns into total losses.
What mistakes do beginners make here?#
- Thinking a +50% bounce undoes a −50% fall
It gets you to 75% of where you were. You need +100%.
- Measuring from your purchase price only
If your holding doubled and then halved, you are back where you started — but you lived through a 50% drawdown and gave back every gain.
- Assuming the asset will come back
Recovery times assume the asset eventually grows again. Some never do.
- Averaging down without a limit
Buying more on the way down can make sense in a plan; without a size limit it can turn a drawdown into a much larger loss.
- Using leverage to recover faster
Leverage deepens the next drawdown as much as it speeds up the recovery.
Frequently asked questions#
What is the difference between a drawdown and a loss?
A loss is measured from what you paid; a drawdown is measured from the highest value reached. You can be in a deep drawdown while still above your purchase price.
Why do the percentages not add up?
Each percentage applies to a different base. −50% applies to the peak; the recovery gain applies to the lower value, so it has to be twice as large.
Is a 90% drawdown possible in crypto?
Yes. Regulators warn that you can lose a large amount or even all of the money invested in crypto-assets [2]. A 90% fall is a smaller step than that.
Can I calculate recovery for my own numbers?
Yes — the drawdown recovery calculator uses the same formulas as this page, with an optional yearly return to estimate time.
Does dollar-cost averaging fix a drawdown?
It lowers your average cost if you keep buying during the fall, which helps only if the price later recovers. See dollar-cost averaging in crypto.
The bottom line#
Drawdown math is lopsided: every extra step down needs a bigger step up, and volatility and leverage make the hole deeper. The time to act on this is before you invest, by sizing positions for the worst case rather than the hoped-for one.
Put your own numbers into the drawdown recovery calculator, then read position sizing in crypto to set limits you can live with.
Sources#
Grade A = primary source (regulator, protocol specification, client code, original author). Grade B = expert secondary source used for explanation only.
- AU.S. Commodity Futures Trading Commission. CFTC Glossary (Bear Market; Correction), 2026.
- AEuropean Supervisory Authorities (EBA, ESMA, EIOPA). EU financial regulators warn consumers on the risks of crypto-assets, 2022.
- AU.S. SEC, Investor.gov. Compound Interest Calculator, 2026.
- AU.S. Federal Trade Commission, Consumer Advice. What To Know About Cryptocurrency and Scams, 2022.
- AU.S. SEC, Investor.gov. Exercise Caution with Crypto Asset Securities: Investor Alert, 2023.
- AU.S. Commodity Futures Trading Commission. Customer Advisory: Understand the Risks of Virtual Currency Trading, 2026.
- AU.S. SEC, Investor.gov. Beginners’ Guide to Asset Allocation, Diversification, and Rebalancing, 2026.
Keep reading

Crypto volatility and risk: how big the swings are and what else can go wrong
Volatility is how far and how fast a price moves. In crypto it is large, but it is only one of several risks. Here is how volatility is measured, why it is so high, and how to prepare for it before you invest.

Position sizing in crypto: deciding how much to put at risk
Position sizing answers one question before every purchase: how much can this lose without hurting me? Diversification and rebalancing keep the answer true over time. Here is the arithmetic, with worked examples.
Dollar-cost averaging in crypto: what it does and what it doesn’t
Dollar-cost averaging means investing the same amount on a schedule, whatever the price. It takes the guesswork out of timing — but it is not a shield against losses. Here is the arithmetic, worked through.