News analysis ·
Cost basis and Proof of Reserves: what Glassnode can't see
Glassnode noted that the October 15 bitcoin dip closed under the ETF cost basis line. We explain how those metrics and reserve tracking work, and their limits.
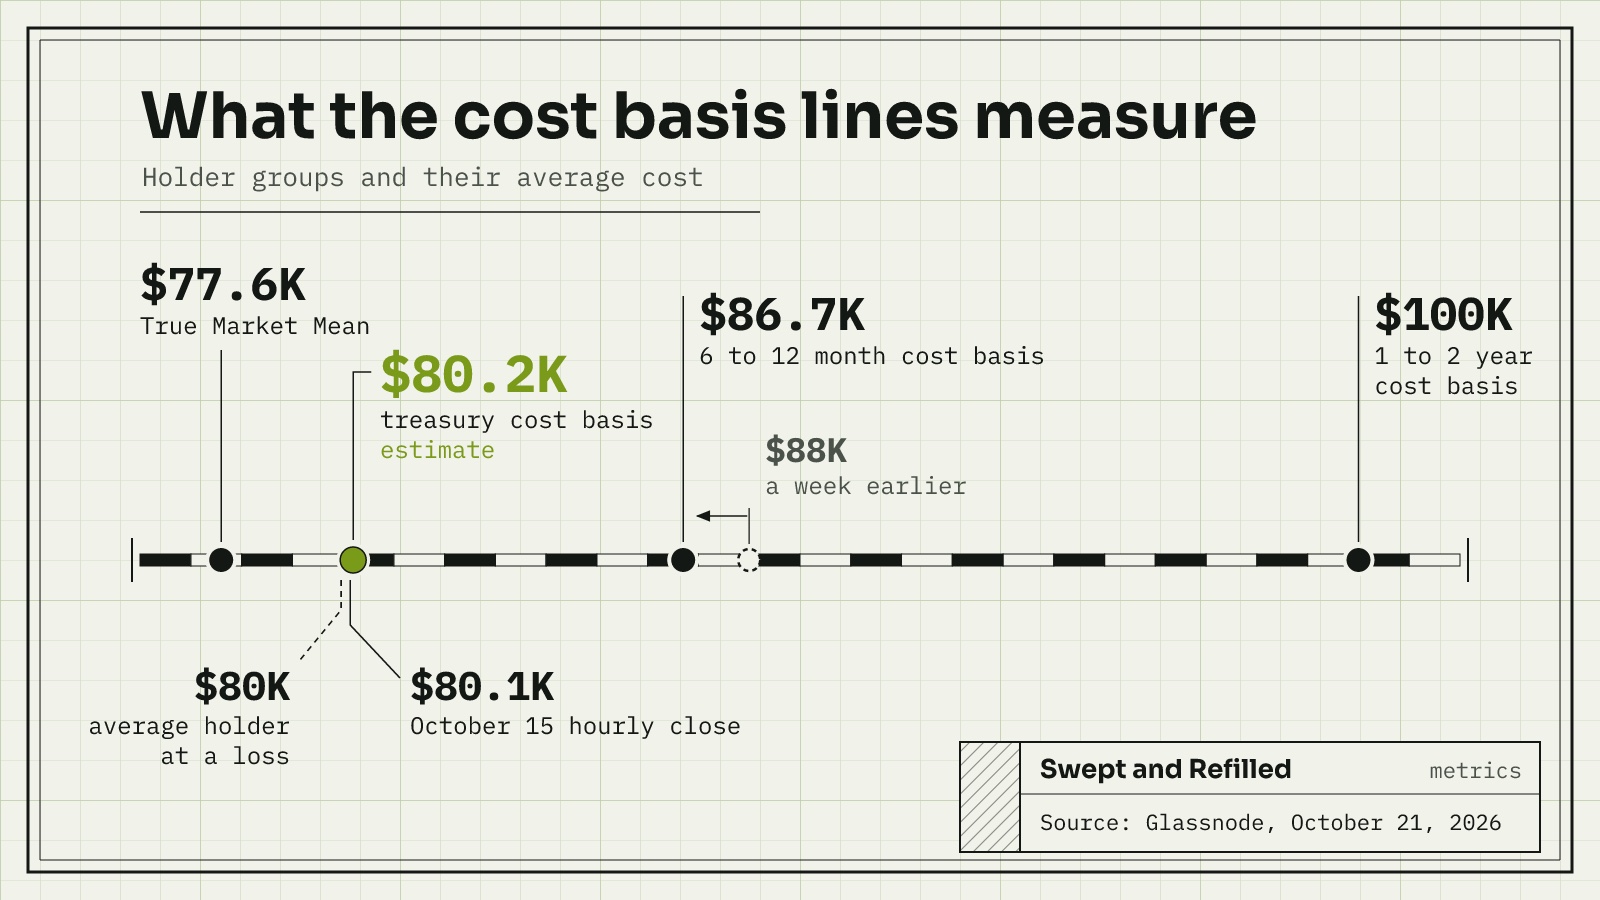
In a market note called Swept and Refilled, published on October 21, 2026, Glassnode described a brief bitcoin dip on October 15 that touched the average cost of two large holder groups. The same note tracked how much bitcoin sits on the addresses exchanges publish. This article looks at what those cost basis and reserve metrics actually measure, how they are built, and where they can mislead.
What the Glassnode note shows
According to Glassnode, the hourly bitcoin close fell to $80.1K on October 15. That was just under the line Glassnode calls the US Spot ETF Cost Basis. The very next hourly close was back above it.
Glassnode also estimates that the treasury companies it tracks hold their bitcoin at an average cost near $80.2K. In its reading, a daily close under $80K would leave both the average ETF holder and the average treasury holder at a loss. A deeper reference, the True Market Mean, sits near $77.6K, and the dip did not reach it.
Higher up, Glassnode places the cost basis of coins bought 6 to 12 months ago near $86.7K, down from the $88K it cited a week earlier. For coins bought 1 to 2 years ago, the line is near $100K.
What is on-chain analysis doing here?
On-chain analysis means reading the public bitcoin ledger to estimate what holders paid and how they behave. In this note, Glassnode uses it to place price next to groups of holders: fund buyers, company buyers, active investors and buyers sorted by when they bought. The question each line answers is simple: is this group, on average, sitting on a gain or a loss?
The metric: how a cost basis line is built
A cost basis is an average purchase price for a group of coins. Glassnode defines the ETF version as the average price US spot bitcoin funds paid for the coins they hold. The treasury figure is different in an important way. Glassnode derives it from the companies' holdings and their unrealized profit, so it is an estimate, not a list of reported purchase prices.
Age-based lines, such as the 6 to 12 month group, work from the ledger itself. Each coin carries the price at the moment it last moved. Averaging those prices across coins of a given age gives that group's cost basis.
Realized Profit uses the same idea. Glassnode describes it as the gain booked when a coin moves at a price above the one at which it last moved. Over the past week, Glassnode said, it ran at roughly half the rate seen around the September high. Realized losses stayed steady, with the largest daily loss of the week in the day ending on the morning of October 15. Glassnode added that daily coin movement by 1 to 2 year holders has dropped below a third of its early October selling peak.
Proof of Reserves: counting what exchanges publish
Glassnode's Proof of Reserves metric follows the addresses that exchanges themselves publish to show their holdings, smoothed as 30-day averages. Glassnode follows 11 exchanges that each keep 1,000 BTC or more there, and six of them now hold a smaller balance than twelve months earlier. Gate grew its reserves by 4.9%. For the typical exchange among the rest, the median change was a 6.4% drop. Leaving out the largest exchange, the remaining ten together hold about 10% less bitcoin than a year earlier, Glassnode said.
Gate also released its own Proof of Reserves report. As of October 18, it said its reserves exceeded user balances by about $1.4 billion, with every major listed asset above 100%. That is the exchange's own comparison, not an on-chain reading by Glassnode.
Limits: where these numbers can mislead
Each of these metrics is useful, but each rests on assumptions a reader should keep in mind.
- Estimates, not receipts: the treasury cost basis is inferred from holdings and unrealized profit, so it can differ from what companies actually paid.
- Last move is not always a sale: Realized Profit counts coins moving above their last price, but a move between a holder's own wallets can look like a booked gain.
- Averages hide spread: a group sitting near its average cost contains many holders well above and well below it.
- Published addresses are only part of the picture: Glassnode warns that exchange balances rely on published addresses plus clustering and can miss reserves when an exchange keeps addresses private.
Glassnode put that last point plainly: "these figures might not always encapsulate the entirety of an exchange’s reserves, particularly when exchanges refrain from disclosing their official addresses". A reserve total also says nothing about liabilities unless the exchange publishes them, which is why Gate's user-balance comparison is a separate claim. Glassnode notes, too, that its latest daily data points remain subject to revision.
What to watch next
The useful habit is to read each line as a description of a group, not as a floor or a ceiling. Watch whether Glassnode revises the recent data, whether more exchanges publish full address lists, and whether reserve reports start to include user balances alongside holdings. Those changes would make the same metrics easier to trust, whatever price does. Bitcoin is volatile, and anyone holding it can lose money; no cost basis line or reserve count removes that risk.
Sources
- Glassnode, 21 Oct 2026
Drafted by AI from the research and on-chain sources listed, then published automatically once checks confirmed the figures against those sources and found no copied text. Not reviewed by a person. Metrics are explained, never turned into price calls.